For a century, immigration registry has provided a legal means for undocumented immigrants to secure a lawful status on the basis of their long-standing residence in the United States. However, Congress has not updated the law since 1986, and the eligibility dates prevent most undocumented immigrants in the U.S. today from applying. By advancing the date, Congress could allow millions of undocumented immigrants who have lived in the U.S. for a long time to once again access a legal, existing path to legal status and citizenship.
Immigration Registry
A potential pathway to citizenship for many immigrants
This immigration process has existed in law for almost a century. With one small update, Congress could make it accessible to millions of immigrants living in the U.S. today.
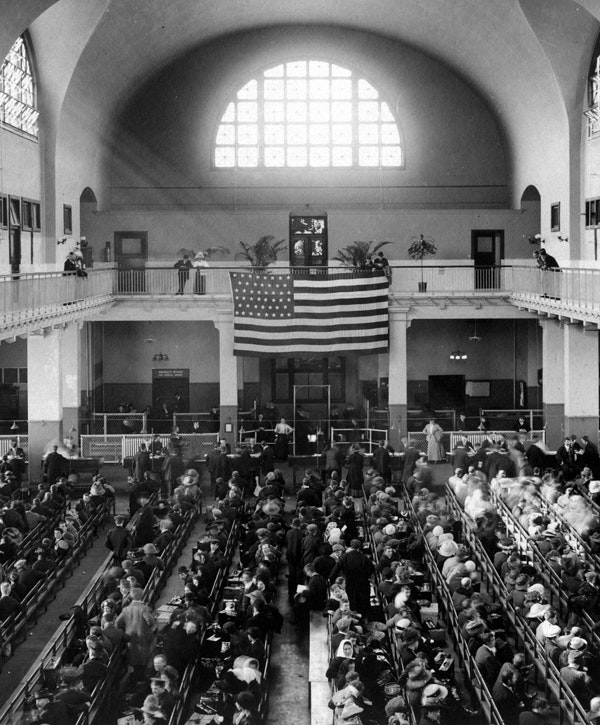

The Great Hall, commonly known as the "Registry Room" at Ellis Island, pictured in 1912 on the left and in the 2000s on the right. This was the main receiving room for arriving immigrants; these contrasting pictures reflect how the U.S. immigration process has evolved over the last century.
History of immigration registry
Immigration registry is a process for immigrants to become lawful permanent residents (green card holders) on the basis of their long-standing presence in the country, regardless of their status or method of entry to the country.1 The Registry Act of 1929 established a process for immigrants to apply for a green card if they could prove that they had arrived before 1921 and had maintained continuous presence, were of “good moral character,” and were not deportable under immigration law. This “registry” process would create an immigration record, including documentation of effective lawful entry, which was a requirement for naturalization.
Congress has updated the immigration registry process throughout its history. Congress has advanced the date of entry cutoff multiple times so that more recent arrivals would be eligible to adjust, and has made minor adjustments to eligibility requirements.2 In 1958, Congress eliminated the requirement that individuals not be deportable under immigration law, expressly extending eligibility to individuals who entered the U.S. unlawfully or overstayed a visa.
A CENTURY OF CHANGES TO REGISTRY LAW
Timeline of legislative changes to registry law, 1929-1996
March 2, 1929
Registry Act
March 2, 1929Registry process established; cutoff date of entry set to 1921
October 14, 1940
Nationality Act
October 14, 1940Cutoff date advanced to 1924
June 27, 1952
Immigration and Nationality Act
June 27, 1952Congress preserved the registry and assigned it its own section by creating INA 249; no changes to cutoff date
August 21, 1958
Amendments to the Immigration and Nationality Act
August 21, 1958Cutoff date advanced to 1940; eligibility requirement changed, deportability no longer disqualifies, shifted to inadmissibility for “criminals, procurers and other immoral persons, subversives, violators of the narcotics laws or smugglers of aliens”
June 30, 1968
Hart-Celler Act
June 30, 1968Cutoff date advanced to 1948
November 6, 1986
Immigration Reform and Control Act
November 6, 1986Cutoff date advanced to 1972 (current date)
October 24, 1988
Immigration Technical Corrections Act
October 24, 1988Added ineligibility if inadmissible as participant in Nazi persecution or genocide
November 29, 1990
Immigration Act
November 29, 1990Individuals barred from applying for five years after missing an immigration hearing (if given prior notice)
April 1, 1997
Illegal Immigration Reform and Immigrant Responsibility Act
April 1, 1997Added ineligibility if deportable for terrorism charges; Immigration Act’s five year bar extended to 10 years
How it works
The immigration registry process is still in effect today. Individuals can apply to adjust status through registry if they arrived in the United States before January 1, 1972; have lived in the country continuously since then; are determined to be “of good moral character”3; and meet other admissibility and deportability requirements. 4
Since 1985, more than 73,000 immigrants have secured a green card through registry; however, as time passes, fewer immigrants are able to meet the cutoff entry date requirement, evidenced by the declining number of immigrants who adjust each year. This is why Congress has repeatedly passed legislation to advance the registry date. Unfortunately, the cutoff date has not been advanced since 1986, meaning individuals have to have lived in the U.S. for nearly 40 years to qualify under current requirements.
Adjustments Through Registry, FY 1985-2021
Fiscal Year | Number of adjustments through registry |
|---|---|
| 1985-1989 | 58,914 |
| 1990-1994 | 9,862 |
| 1995 - 1999 | 1,368 |
| 2000 - 2004 | 1,214 |
| 2005 - 2009 | 1,105 |
| 2010 - 2014 | 606 |
| 2015 - 2019 | 305 |
| 2020 - Present | 215 |
| Total | 73,589 |
Sources: Department of Homeland Security's Yearbook of Immigration Statistics (FY 1996-2021), Congressional Research Service (FY 1985-1995).
Existing process for future legalization efforts in Congress
By advancing the date of entry cutoff, Congress could extend access to immigration registry for millions of undocumented immigrants who have lived, worked, and raised families in the United States for years,5 allowing them to secure legal status.
Estimated number of eligible undocumented immigrants by potential registry year
Registry year | Impacted Undocumented Population |
|---|---|
| 2003 | 3,660,000 |
| 2004 | 3,980,000 |
| 2005 | 4,310,000 |
| 2006 | 4,740,000 |
| 2007 | 5,070,000 |
| 2008 | 5,330,000 |
| 2009 | 5,560,000 |
| 2010 | 5,740,000 |
| 2011 | 6,010,000 |
| 2012 | 6,190,000 |
| 2013 | 6,400,000 |
| 2014 | 6,630,000 |
| 2016 | 7,310,000 |
| 2017 | 7,780,000 |
| 2018 | 8,170,000 |
Source: FWD.us analysis of augmented 2021 American Community Survey data.
Note: Estimates assume registry date would be set on the first of the year; e.g. for 2011 registry year, the registry date would be January 1, 2011, and include immigrants who entered the U.S. prior to that date.
Note: Estimates assume registry date would be set on the first of the year; e.g. for 2011 registry year, the registry date would be January 1, 2011, and include immigrants who entered the U.S. prior to that date.
Advancing the immigration registry date is not a novel concept and is in line with Congressional intent. Registry has been enshrined in law for nearly a century, and Congress has expressly intended registry to be a mechanism for undocumented immigrants to adjust to lawful permanent resident status. Additionally, eligibility requirements for immigration registry are broad, so many people can qualify,6 but relief is discretionary and considered case by case.
Congress has a few options for modernizing the immigration registry process. Congress could advance the cutoff date as it has done before, typically about 10 to 15 years before the date of a bill’s passage (e.g., the 1986 bill established an entry date of January 1, 1972). To avoid having to update the registry date, a more robust immigration system permitting more immigrants to enter the country would be needed.
An additional option is a “rolling” cutoff date that automatically adjusts. The date could advance by one year with each year that passes,7 or could be determined by the individual’s date of entry, so they would be eligible to file a registry application after being present in the U.S. for a set period.8 This approach would be the most flexible, and would reflect Congressional intent to recognize long-standing residence as a positive factor for an individual seeking legal status.
Conclusion
The immigration registry process has been in place for nearly a century, and reflects our nation’s historical sense of fairness to allow undocumented immigrants who have lived in the country for a long time an opportunity to adjust to a legal status.
Whatever the process, it is critical that Congress establish a pathway to citizenship for the millions of undocumented immigrants currently living in the U.S. They grow and distribute our food, help nurture our children and elderly, maintain our infrastructure, and serve as a significant source of our essential workers while combating the global coronavirus pandemic. This would benefit all Americans, and is urgently needed.
To see more information about population size and economic impact of undocumented immigrants living in the U.S. 10 or more years, see our Citizenship report, including tools for state and Congressional district estimates.
Get in touch with us:
Andrew Moriarty
Deputy Director of Federal Policy
Thousands of Undocumented Immigrants in Each State Could Benefit From Registry Adjustment
Estimates – number and percent – of undocumented immigrants, by year of entry and state
Entered 2012 or earlier (10 years or longer in U.S.) | Entered 2007 or earlier (15 years or longer in U.S.) | ||||
|---|---|---|---|---|---|
State | Estimated number of undocumented immigrants | % of state's undocumented immigrants | Estimated number of undocumented immigrants | % of state's undocumented immigrants | |
| Alabama | 41,000 | 68 | 32,000 | 54 | |
| Alaska | 3,000 | 37 | 2,000 | 34 | |
| Arizona | 171,000 | 76 | 152,000 | 67 | |
| Arkansas | 42,000 | 74 | 36,000 | 62 | |
| California | 1,455,000 | 77 | 1,277,000 | 68 | |
| Colorado | 112,000 | 68 | 92,000 | 56 | |
| Connecticut | 55,000 | 56 | 42,000 | 42 | |
| Delaware | 14,000 | 66 | 10,000 | 50 | |
| District of Columbia | 7,000 | 58 | 6,000 | 46 | |
| Florida | 427,000 | 50 | 336,000 | 39 | |
| Georgia | 221,000 | 69 | 181,000 | 56 | |
| Hawaii | 20,000 | 64 | 14,000 | 47 | |
| Idaho | 28,000 | 70 | 23,000 | 57 | |
| Illinois | 282,000 | 76 | 251,000 | 67 | |
| Indiana | 61,000 | 67 | 50,000 | 55 | |
| Iowa | 25,000 | 59 | 19,000 | 44 | |
| Kansas | 47,000 | 71 | 40,000 | 60 | |
| Kentucky | 24,000 | 53 | 20,000 | 43 | |
| Louisiana | 25,000 | 41 | 21,000 | 35 | |
| Maine | 3,000 | 46 | 1,000 | 23 | |
| Maryland | 126,000 | 58 | 96,000 | 44 | |
| Massachusetts | 73,000 | 55 | 53,000 | 40 | |
| Michigan | 66,000 | 68 | 53,000 | 54 | |
| Minnesota | 57,000 | 64 | 43,000 | 49 | |
| Mississippi | 13,000 | 53 | 9,000 | 39 | |
| Missouri | 35,000 | 62 | 28,000 | 49 | |
| Montana | 3,000 | 56 | 3,000 | 52 | |
| Nebraska | 28,000 | 62 | 24,000 | 54 | |
| Nevada | 111,000 | 74 | 103,000 | 68 | |
| New Hampshire | 7,000 | 48 | 5,000 | 36 | |
| New Jersey | 237,000 | 58 | 189,000 | 46 | |
| New Mexico | 34,000 | 68 | 31,000 | 62 | |
| New York | 376,000 | 65 | 294,000 | 51 | |
| North Carolina | 200,000 | 66 | 175,000 | 57 | |
| North Dakota | 5,000 | 50 | 2,000 | 18 | |
| Ohio | 47,000 | 44 | 38,000 | 35 | |
| Oklahoma | 50,000 | 70 | 43,000 | 60 | |
| Oregon | 82,000 | 73 | 72,000 | 65 | |
| Pennsylvania | 82,000 | 49 | 59,000 | 35 | |
| Rhode Island | 12,000 | 53 | 10,000 | 46 | |
| South Carolina | 59,000 | 64 | 49,000 | 52 | |
| South Dakota | 5,000 | 52 | 2,000 | 25 | |
| Tennessee | 84,000 | 59 | 71,000 | 50 | |
| Texas | 1,073,000 | 65 | 876,000 | 53 | |
| Utah | 66,000 | 66 | 59,000 | 59 | |
| Vermont | 3,000 | 60 | 1,000 | 29 | |
| Virginia | 143,000 | 62 | 113,000 | 49 | |
| Washington | 191,000 | 74 | 165,000 | 64 | |
| West Virginia | 2,000 | 42 | 1,000 | 29 | |
| Wisconsin | 62,000 | 75 | 52,000 | 64 | |
| Wyoming | 5,000 | 81 | 4,000 | 66 | |
Source: FWD.us analysis of 2021 American Community Survey augmented data
Note: Estimates rounded to the nearest 1,000. Undocumented immigrants consist of Dreamers, including Deferred Action for Childhood Arrivals (DACA) recipients, Temporary Protected Status (TPS) holders, Deferred Enforced Departure (DED) holders, asylum seekers waiting on a decision, those waiting on an adjustment or change of status, and other undocumented immigrants.
Notes
- Legislation passed in 1924 had imposed permanent numerical limits on immigration and expanded grounds for deportability, leading to an increase in the unauthorized population. The immigration registry process was established in response to concerns over this increased unauthorized population. In a way, registry provided a remedy to legalize the population who had already lived in the country for a long time but were now considered unauthorized, Congressional Research Service, “Legalization Framework Under the Immigration and Nationality Act (INA),” https://fas.org/sgp/crs/homesec/R45993.pdf.
- The date of entry cutoff has been advanced four times: in 1940, advanced to 1924; in 1958, advanced to 1940; in 1965, advanced to 1948; and in 1986, advanced to 1972, the current date. In 1958, Congress removed the requirement that applicants not be deportable under immigration law, extending eligibility to individuals who entered unlawfully or overstayed visas. In 1988, Congress barred eligibility for individuals with ties to the Nazi party; in 1990, Congress barred individuals who missed an immigration hearing from applying for five years; and in 1996, Congress extended that bar to 10 years, and further barred eligibility for individuals who are deportable for ties to terrorist activities, Congressional Research Service, “Immigration: Registry as Means of Obtaining Lawful Permanent Residence,” https://www.everycrsreport.com/reports/RL30578.html
- “Good moral character” is a concept in immigration law and a requirement to be eligible for naturalization. U.S. Citizenship and Immigration Services (USCIS) defines good moral character as “up to the standards of average citizens of the community in which the applicant resides.” USCIS officers review records, statements, and oral testimony to make a subjective determination if an applicant meets the “good moral character” requirement. Some criminal convictions and other actions can result in permanent bars to establishing “good moral character.”
- Individuals cannot adjust through registry if they are deportable because of ties to terrorist activity; are inadmissible because of participation in Nazi persecution, genocide, torture, or extrajudicial killings; are broadly determined to be “a criminal, procurer, other immoral person, subversive, violator of the narcotics laws or alien smuggler”; or are permanently ineligible for citizenship. (This mainly refers to individuals who requested an exemption from military service because they are immigrants who left the country to avoid being drafted, or who deserted their military service, see https://www.uscis.gov/policy-manual/volume-12-part-i-chapter-4.) Regardless of meeting the above criteria, the individual may still be denied if it is deemed that he or she does not merit favorable exercise of discretion. For more, see https://www.uscis.gov/policy-manual/volume-7-part-o-chapter-4.
- When Congress advanced the immigration registry cutoff date in 1958, the Senate cited the growing number of private bills being introduced to allow long-term residents to receive permanent status as justification for updating the law. Since the 112th Congress (2001-2002), hundreds of private bills have been introduced to grant relief and legal status to individual undocumented immigrants.
- The broad and flexible requirements for immigration registry are a stark contrast to the rigorous requirements typically included in one-off legalization proposals. In fact, Congress debated updates to registry in the 1990s because of legal challenges to the implementation of the legalization program established under IRCA that prevented many people from adjusting status; while Congress did not advance the date, it did pass and implement the LIFE Act (Pub. L. 106-553), which allowed for adjustment for certain individuals who would have been eligible under IRCA and who had filed to join class action lawsuits.
- This approach was proposed in bills like the Working Family Registry Act of 2001 (S. 562), though this bill would advance the entry date only through five years; after 2006, the date would stay static.
Tell the world; share this article via...

Get Involved
Help us chart a path forward on justice and immigration.
Loading...


