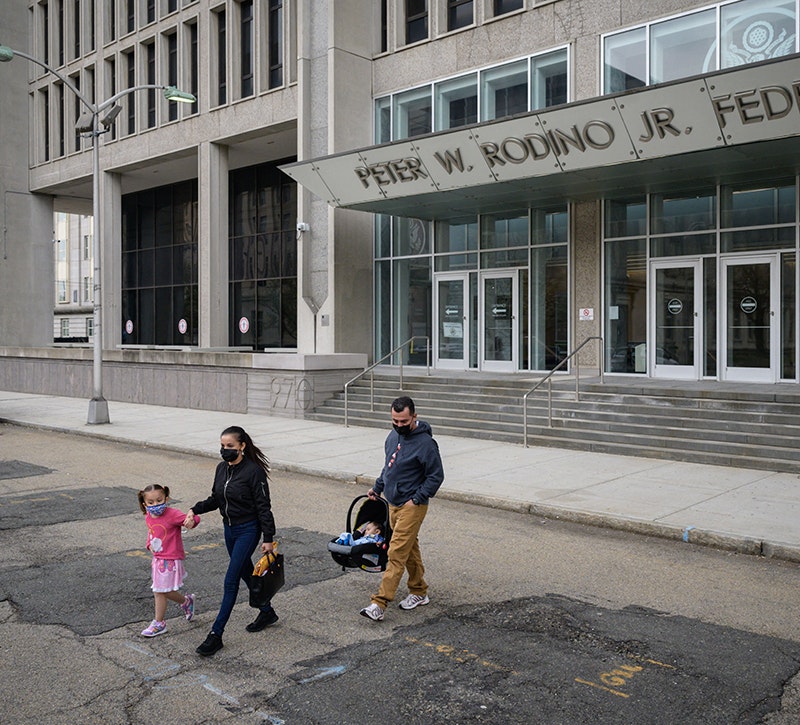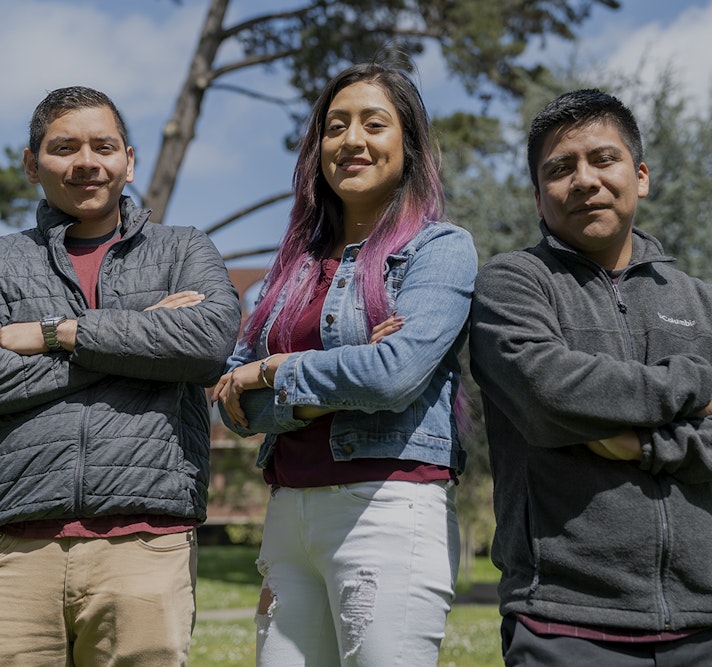
More houses were built, supply chains were reestablished, our food supply was secured, and the tourist industry was able to keep up with demand in recent years largely because of the estimated 740,000 individuals who have entered the U.S. with immigration parole between 2021 and 2024, and are now working in the U.S. labor force, according to estimates from FWD.us.
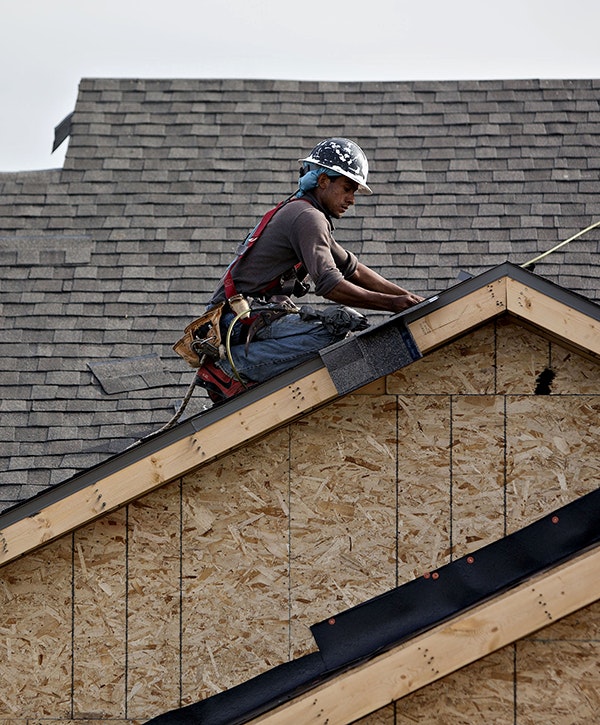
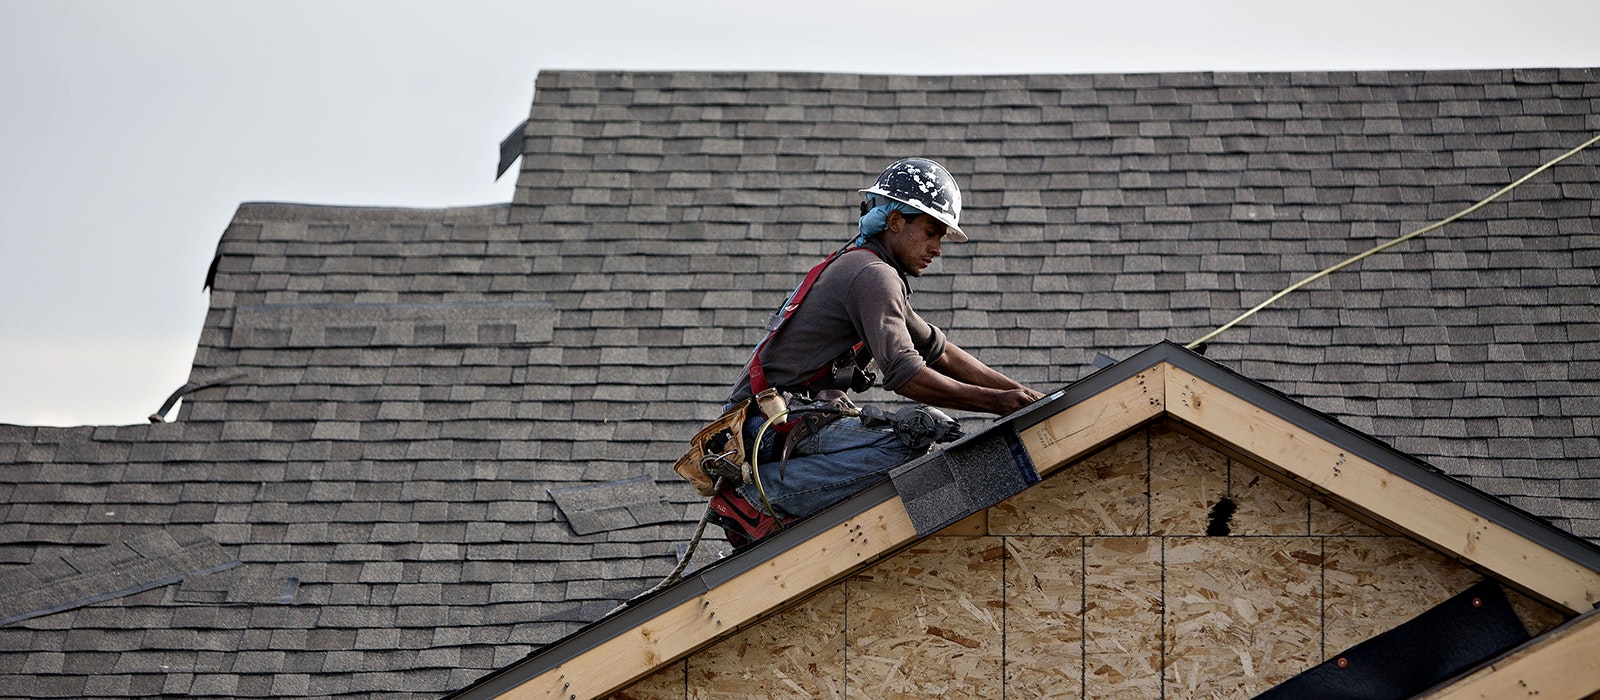
With labor demand at all-time highs coming out of the COVID-19 pandemic and a growing economy for years thereafter, paroled immigrants have made a sizable difference toward closing labor gaps, including adding 120,000 construction workers to the U.S. workforce, 120,000 in the leisure and hospitality industry, and 90,000 in manufacturing, among other sectors.