Data sources:
Information on current 287(g) agreements was last downloaded from the Maxwell Commons Newsletter 287(g) Program Tracker on Oct. 1, 2026. Arrest data were provided by ICE in response to a FOIA request, processed by the Deportation Data Project, and last retrieved on Sept. 17, 2026, and analyzed by FWD.us. Analysis also relied on the U.S. Bureau of Justice Statistics Census of State and Local Law Enforcement Agencies, last collected in 2018; the contents of a leaked ICE ledger, originally published by independent journalist Ken Klippenstein on March 24, 2025 and subsequently digitized and analyzed by FWD.us; and a June 2026 spreadsheet, published by the Florida Department of Law Enforcement for the State Board of Immigration Enforcement, detailing each Florida law enforcement agency’s degree of participation in the 287(g) program. U.S. Census Bureau population estimates at the county and subcounty level were utilized, as were mean annual salaries by state as reported by the Bureau of Labor Statistics Occupational Employment and Wage Statistics for police and sheriff’s patrol officers. Federal workforce data from the Office of Personnel Management were also consulted.
Methodology:
In order to create a reliable estimate of the number of sworn local and state officers deputized as part of the Task Force Model, we first had to build a reliable estimate of the overall size of sworn officer forces of active participating agencies. The current agreements list was matched to the most recent Census of State and Local Law Enforcement Agencies (CSLLEA) and to the spreadsheet published by Florida’s State Board of Immigration Enforcement (SBIE), as well as U.S. Census datasets to fill in any missing jurisdictional population information. Agency and city names were manually adjusted for slight variations in spelling and ordering, as needed. One duplicate agency was removed from the analysis (Parker County District Attorney's Office in Texas).
Approximately 72% of participating agencies with active Task Force Model agreements corresponded to an entry in either the CSLLEA (1,155 agencies) or the Florida SBIE dataset (276 agencies), with 91 agencies appearing in both. In comparing the Florida agencies that reported force sizes across both in the 2018 and 2026 datasets, it was clear that those forces had grown substantially over the reporting period. Nearly 80% of these agencies increased their number of full-time sworn officers, adding a median of 19 additional sworn officers, and a dozen agencies added more than a hundred new sworn officers relative to 2018. These trends echo strong growth in the number of law enforcement officers as reported by the Bureau of Labor Statistics over this period for Florida as well as several other states that appear prominently in this analysis, including Oklahoma, South Carolina, and Wyoming. But not all states experienced growth over this period and overall, the number of police officers and sheriffs deputies has been relatively flat across the country, growing approximately 1% from 2018 to 2025 based on Bureau of Labor Statistics occupational tables. Because of the uncertainty regarding the total number of sworn officers by agency and how it has changed between 2018 and now, we present a range of possible values, using no growth from 2018 as the low end of the range and growth similar to Florida as the high end of the range. In simplified forms such as the interactive map tool, we have displayed the midpoint of the range.
Current sworn officer totals were projected at the low end using sworn officer totals and the jurisdictional populations from the time of data collection for the CSLLEA to estimate the relationship between the sworn officer force and an agency’s jurisdictional population, separating out regression models for municipal and county agencies. (Municipal regression: n=601, adjusted R-squared=.96. County regression: n=467, adjusted R-squared=.77). For the high-end estimates, identical regression models were run using SBIE data and corresponding U.S. Census population data. (Municipal regression: n=173, adjusted R-squared=.88. County regression: n=68, adjusted R-squared=.91). These estimates were then applied to predict the sworn officer forces of all participating agencies, based on more recent population estimates.
To estimate the number of officers deputized by ICE under the Task Force Model, the percent of the sworn officer force participating in the program according to the ICE ledger was then applied to the high- and low-end range of full force estimates for non-state agencies outside of Florida, broken out by municipal and county agencies as well as the relative size of their populations. The number of deputized officers as reported in SBIE data was preserved for Florida agencies, as were the deputized officer estimates from the ICE ledger for agencies outside of Florida included in that document. For all county or municipal agencies for which jurisdictional populations were unavailable, a single deputized officer was assumed.
A manual review of online news coverage and press releases was conducted for all participating state-level highway patrol and police agencies or the agencies that oversee them. Where located, reported tallies of deputized officer forces were included in the analysis. Tallies for agencies that deputized more officers than initially indicated on the ICE ledger were updated.
No estimates were made for state-level agencies given the wide range of force sizes and participation (some credentialed only a handful of officers, while others have deputized their entire forces). As a result, this report’s estimates are quite conservative, as they fail to include any estimated officers for the state police in Indiana, Louisiana, New Hampshire, and West Virginia, nor for the highway patrol in Montana, South Carolina, or Texas, among others.
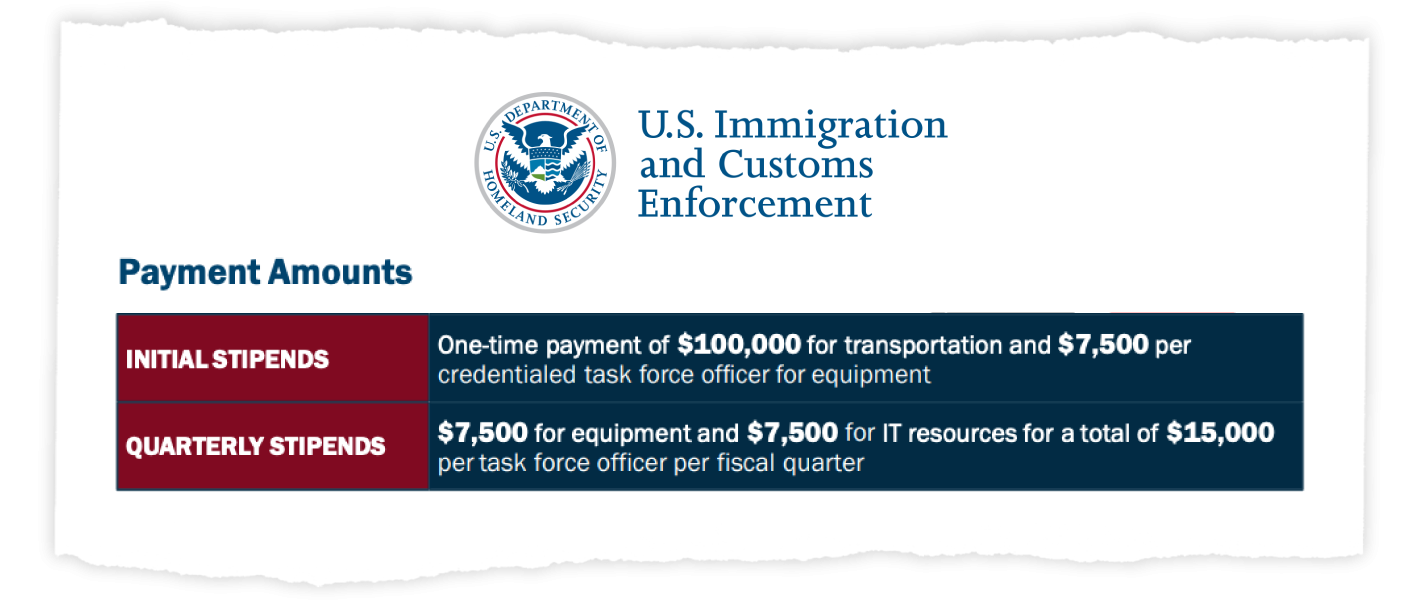
Deputized officer estimates were then used to calculate the funds agencies are eligible to seek for payment based on start-up costs (including vehicle and equipment stipends) and quarterly stipends. Salary and benefits were estimated using mean officer salaries from the Bureau of Labor Statistics, a benefits multiplier of 33%, and the number of 287(g) arrests conducted in each state between January 2025 and early August 2026. Officer time of roughly 3 hours per arrest was estimated, and arrests were assumed to continue at the same pace they had occurred over the last three months of available arrest data, from May to early August 2026, through the end of FY 2027.
Arrest data were cleaned to remove likely duplicate entries as identified by the Deportation Data Project. Relevant arrests were then identified via reference to 287(g) in either the apprehension method or final program variables. As discussed in the body of this report, arrests totals may include arrests undertaken pursuant to any 287(g) program, including Jail Enforcement Model or Warrant Service Officer program.
To provide a comparison to the size of the deputized force under the 287(g) Task Force Model, federal workforce data was obtained from the U.S. Office of Personnel Management. ICE’s Enforcement Removal Operations (ERO) deportation officers are housed within the 1801 occupational series, which contains just under 11,600 employees as of August 2026, the most recent data available. This appears to be the closest approximation of sworn ICE officers conducting interior enforcement operations. An additional nearly 8,500 ICE employees are classified under the 1811 criminal investigator series. In addition to these employees, the ACLU reports that law enforcement personnel from across DHS and a number of other federal agencies, including the FBI, DEA, and ATF, have also carried out interior enforcement operations. According to a disclosure received by the Cato Institute, more than 28,000 federal law enforcement employees had been diverted or reassigned to support immigration enforcement efforts as of August 2025. It is not clear to what extent these reassignments continue to this day.
Note on cancelled 287(g) agreements:
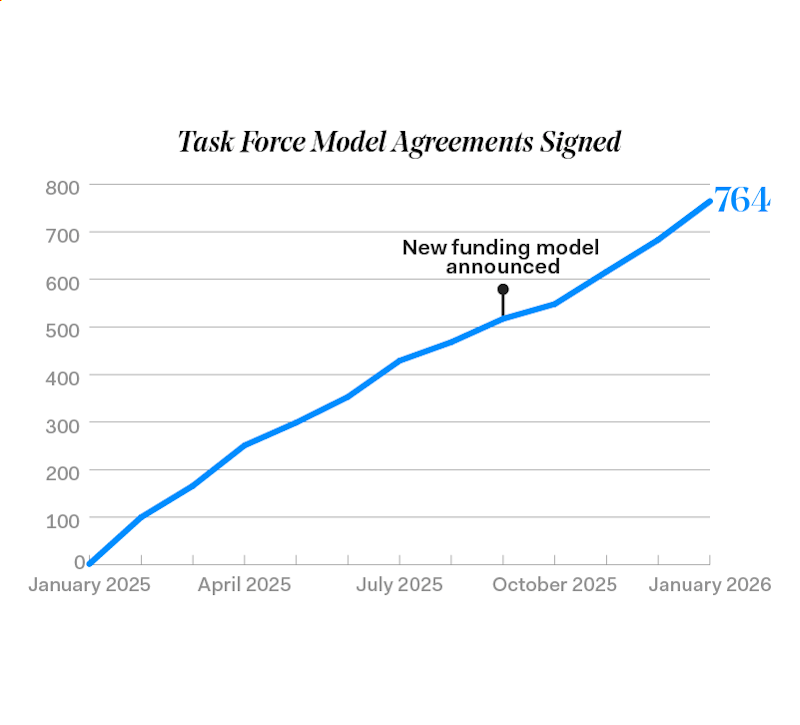
Analysis presented in this report relies on the list of active participating agencies as of Oct. 1, 2026. ICE does not publish data on 287(g) agreements that have been cancelled or voided by court order, but the 287(g) Program Tracker maintained by Andrew Thrasher has identified at least 74 Task Force Model agreements that have been removed from ICE’s published list since February 2025. A new dataset from the Deportation Data Project published on October 16, 2026 likewise tracks all active and historic 287(g) agreements, featuring 2,055 Task Force Model agreements signed since 2002.
At least one additional agency (Pinal County Attorney’s Office in Arizona) continues to appear listed as “active” despite a judicial order declaring the agreement void in May 2026. As this is the only Arizona 287(g) Task Force Agreement agreement, Arizona has been excluded from the interactive map tool and from national totals. Twenty additional agreements with Virginia localities that are currently subject to litigation but remain active pending resolution of the litigation have been retained in this analysis.