Black immigrants make the U.S. stronger

FWD.usHaitian Bridge AllianceNAACPUndocuBlack

The some 5 million Black immigrants living in the United States represent a vital part of our national fabric. Hailing primarily from Caribbean nations like Haiti and Jamaica, and African countries including Nigeria and Ethiopia, these individuals and families contribute billions to our economy, serve in our hospitals and schools, and strengthen communities from coast to coast. Yet current immigration enforcement policies pose unique threats to Black communities, who face disproportionate targeting through the intersection of racialized policing and immigration enforcement. This fact sheet highlights both the essential contributions of Black immigrants and the urgent need to protect these communities from harmful enforcement practices.

5.1 million Black immigrants live across the United States, making up 12% of all Black residents.

Black immigrant population by state

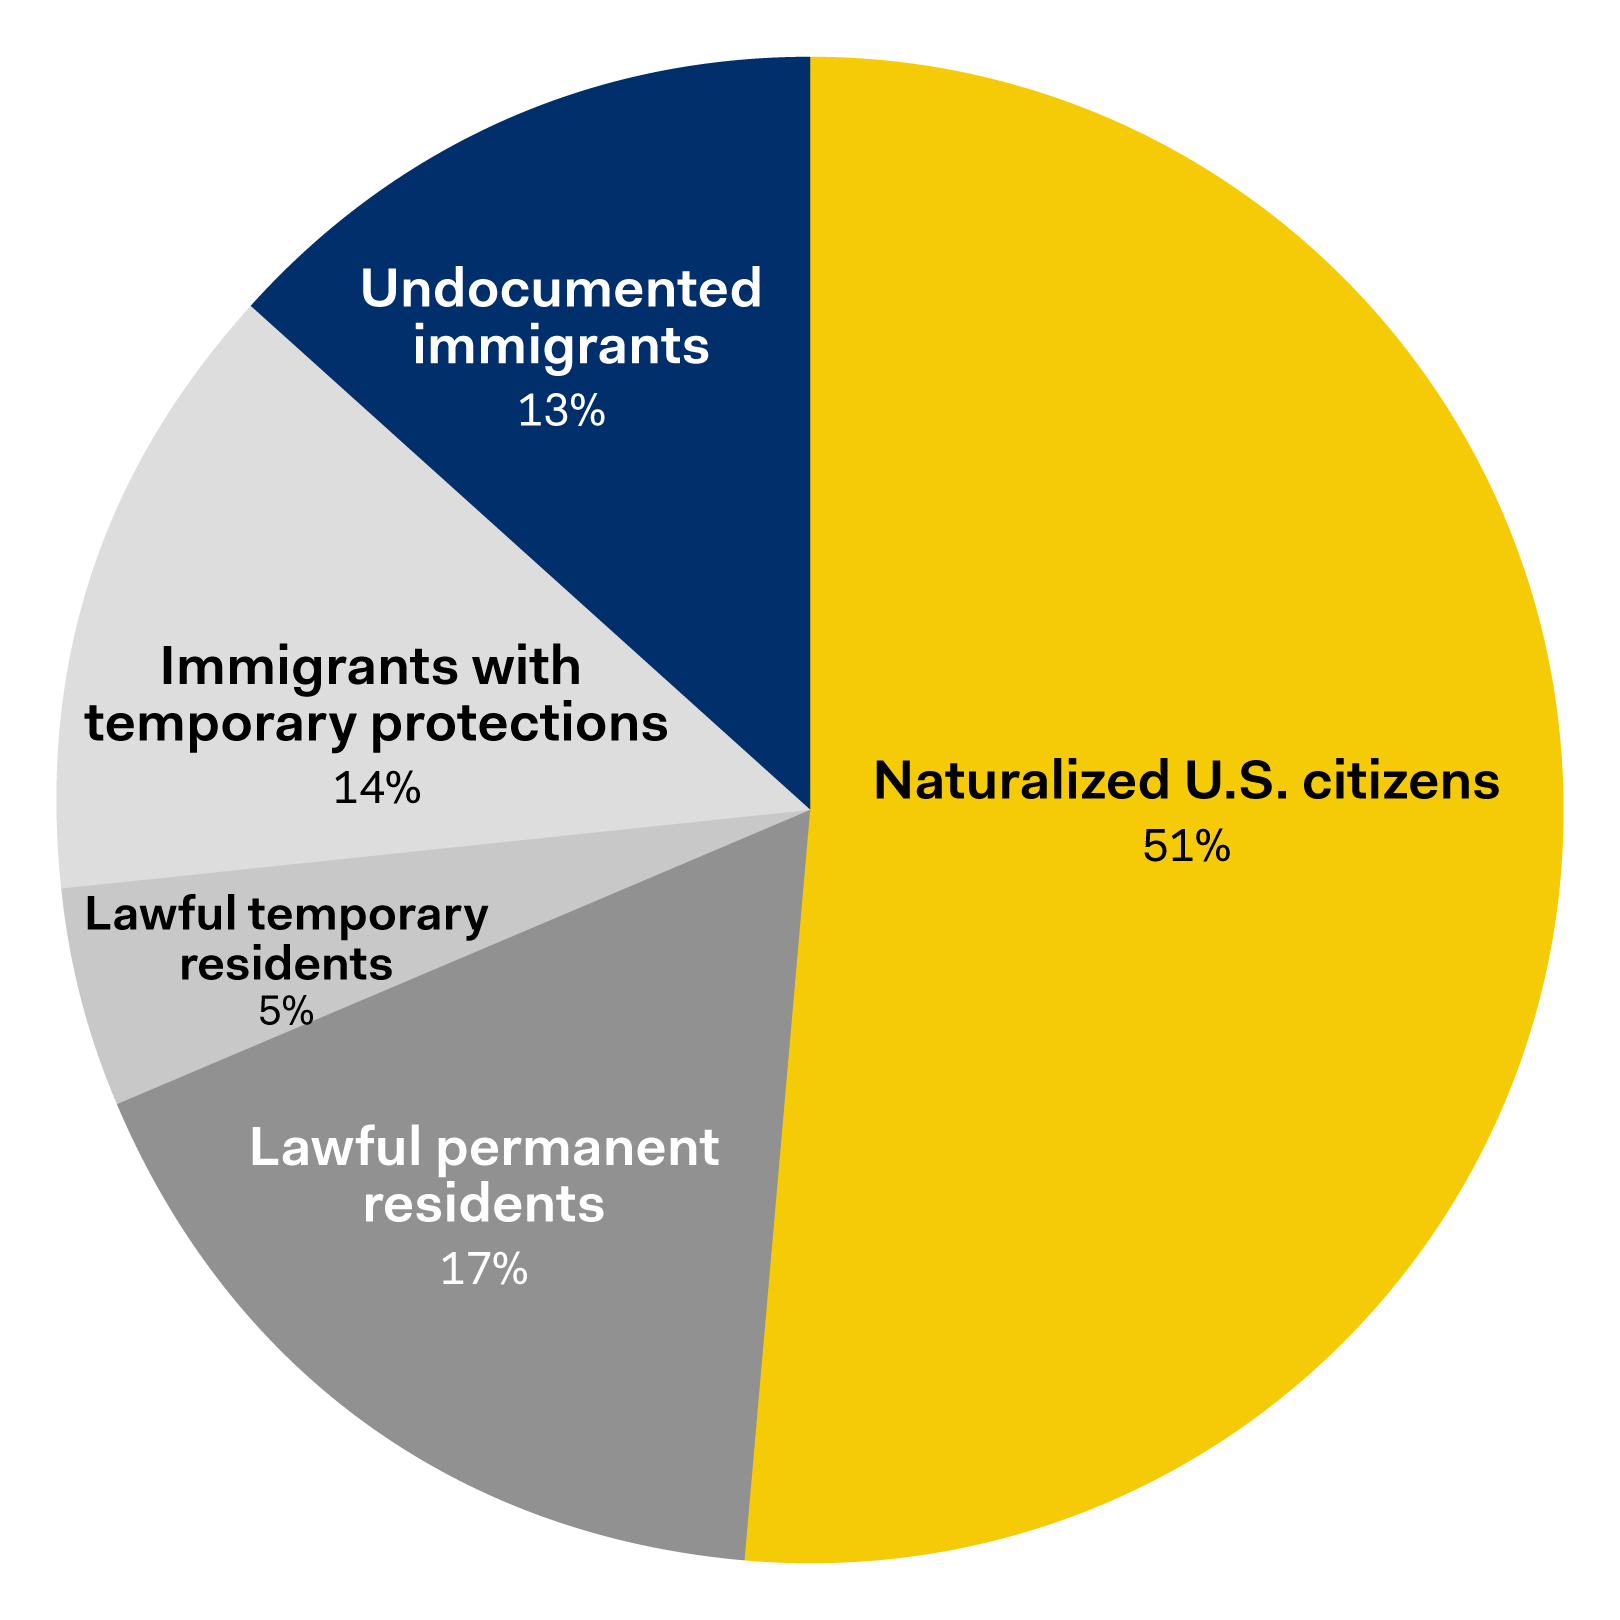
The overwhelming majority of Black immigrants reside lawfully in the U.S.

Black immigrant legal status breakdown

Nearly half (48%) of Black immigrants, or nearly 2.5 million, were born in Caribbean countries like Haiti (1,134,000), Jamaica (845,000), Trinidad and Tobago (171,000), Dominican Republic (64,000), and Guyana (59,000).
Nearly half (47%) of Black immigrants, or more than 2.4 million, were born in African countries like Nigeria (550,000), Ethiopia (314,000), Ghana (219,000), Kenya (170,000), and Somalia (107,000).
More than half (51%) of Black immigrants are female, slightly lower than Black individuals born in the U.S. (53%).
On balance, Black immigrants are older (median age 42) than Black individuals born in the U.S. (median age 34). On average, Black immigrants have lived in the U.S. for 14 years.

Black immigrants contribute an estimated $182 billion to the U.S. economy each year

$35B
in federal & payroll taxes annually
$25B
in state & local taxes annually

Black immigrants contribute billions each year to metro economies

New York$34.4B
Miami$14.5B
Washington, D.C.$13.3B
Atlanta$9.1B
Dallas–Fort Worth$6.7B
Houston$6.4B
Boston$5.1B
Philadelphia$4.9B
Orlando$4.2B
Minneapolis$4.1B
Baltimore$3.9B
Chicago$3.2B

3.5 million Black immigrants are in the U.S. workforce.

Restricting Black immigrants from doing their jobs will drive up everyday costs for everyday Americans, raising the prices of health care, food, goods, and essential services.

363,000 nursing personnel
serving hundreds of thousands of patients daily
81,000 computer specialists
assisting hundreds of thousands of people daily
193,000 retail staff
serving millions of customers daily
80,000 caregivers
serving tens of thousands of children and aging parents daily
167,000 cooks and servers
serving millions of meals daily
72,000 information and records clerks
processing hundreds of thousands of documents daily
143,000 delivery drivers
delivering millions of parcels daily
71,000 taxi drivers
moving more than a million people daily
111,000 protection service workers
providing safety to millions of people daily
71,000 custodians
cleaning thousands of buildings daily
99,000 teachers
supporting hundreds of thousands of students daily
67,000 counselors and social workers
helping hundreds of thousands of people daily
90,000 healthcare technicians
treating hundreds of thousands of patients daily
65,000 financial specialists
assisting hundreds of thousands of clients daily
84,000 factory machine operators, stockers, and packers
handling millions of items daily
48,000 business and human resource specialists
serving millions of people daily

1.7 million U.S. citizen children depend on their Black immigrant parent's contributions to the U.S. workforce.

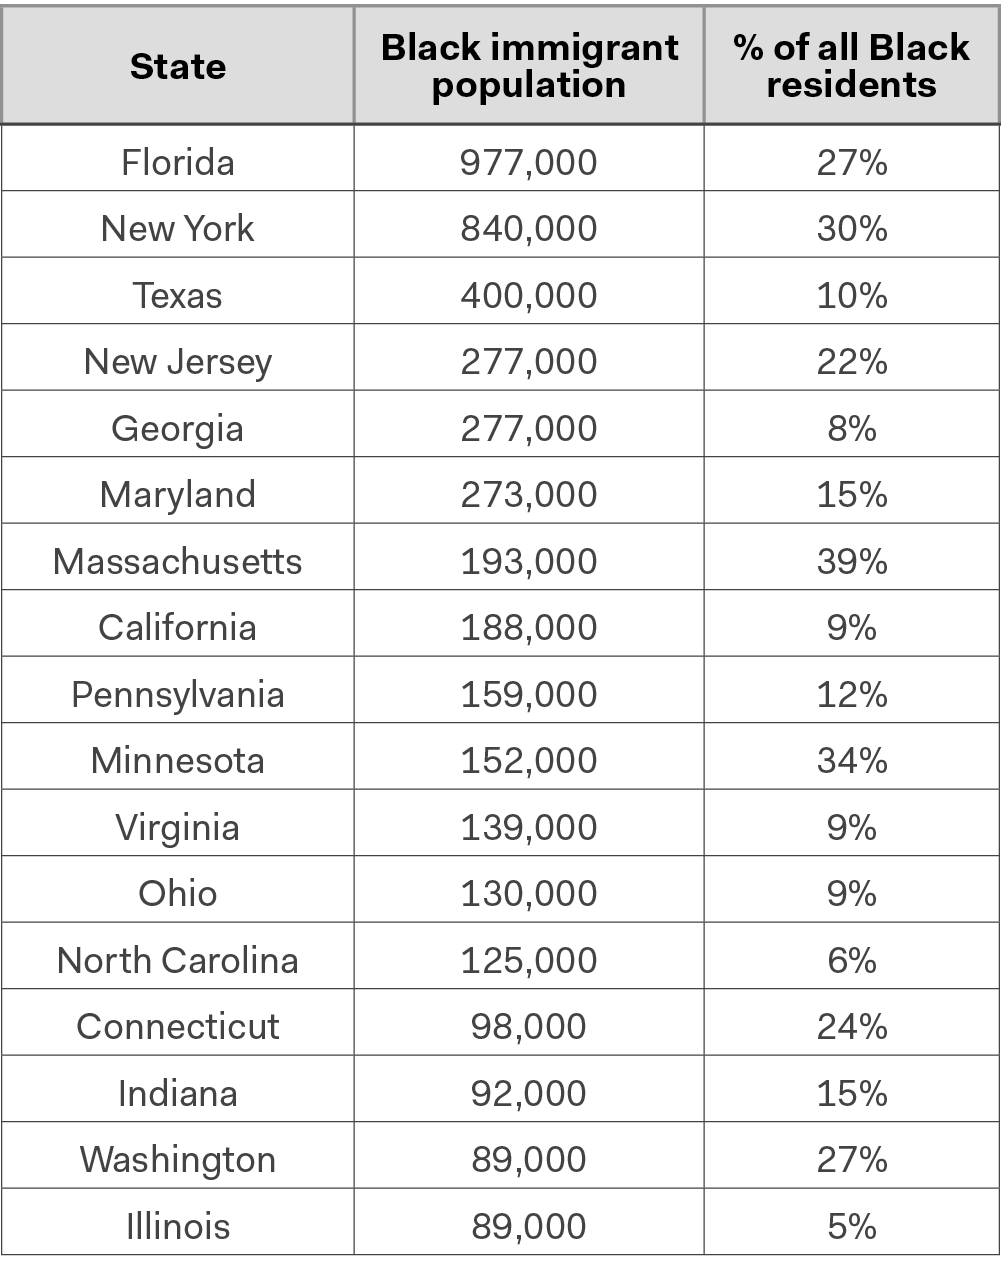
Black Immigrants Make Our Communities Stronger from Coast to Coast

FloridaFlorida

598,000 Black immigrant workforce, including 57,000 cooks and servers, 56,000 nursing personnel, 37,000 retail staff, 26,000 delivery drivers, and 21,000 protection service workers
$26.8 billion in annual economic contributions
$4.2 billion in annual federal and payroll taxes
$3.0 billion in annual state and local taxes

MarylandMaryland

209,000 Black immigrant workforce, including 30,000 nursing personnel, 13,000 retail staff, 12,000 computer specialists, 8,000 protection service workers, and 6,000 healthcare technicians
$12.2 billion in annual economic contributions
$2.7 billion in annual federal and payroll taxes
$1.8 billion in annual state and local taxes

New YorkNew York

536,000 Black immigrant workforce, including 57,000 nursing personnel, 48,000 caregivers, 29,000 protection service workers, 28,000 retail staff, and 17,000 teachers
$28.2 billion in annual economic contributions
$5.9 billion in annual federal and payroll taxes
$5.1 billion in annual state and local taxes

MassachusettsMassachusetts

134,000 Black immigrant workforce, including 17,000 nursing personnel, 8,000 cooks and servers, 8,000 retail staff, 6,000 counselors and social workers, and 4,000 healthcare technicians
$6.8 billion in annual economic contributions
$1.3 billion in annual federal and payroll taxes
$0.8 billion in annual state and local taxes

TexasTexas

291,000 Black immigrant workforce, including 28,000 nursing personnel, 14,000 retail staff, 13,000 delivery drivers, 12,000 protection service workers, and 11,000 computer specialists
$16.8 billion in annual economic contributions
$3.4 billion in annual federal and payroll taxes
$1.9 billion in annual state and local taxes

CaliforniaCalifornia

134,000 Black immigrant workforce, including 17,000 nursing personnel, 7,000 retail staff, 5,000 delivery drivers, 4,000 teachers, and 4,000 healthcare technicians
$8.9 billion in annual economic contributions
$2.1 billion in annual federal and payroll taxes
$1.3 billion in annual state and local taxes

New JerseyNew Jersey

202,000 Black immigrant workforce, including 23,000 nursing personnel, 10,000 retail staff, 8,000 delivery drivers, 8,000 caregivers, and 7,000 healthcare technicians
$9.9 billion in annual economic contributions
$2.0 billion in annual federal and payroll taxes
$1.4 billion in annual state and local taxes

PennsylvaniaPennsylvania

104,000 Black immigrant workforce, including 10,000 nursing personnel, 7,000 retail staff, 3,000 delivery drivers, 3,000 healthcare technicians, and 3,000 counselors and social workers
$4.8 billion in annual economic contributions
$0.8 billion in annual federal and payroll taxes
$0.7 billion in annual state and local taxes

GeorgiaGeorgia

191,000 Black immigrant workforce, including 16,000 nursing personnel, 14,000 retail staff, 10,000 cooks and servers, 9,000 delivery drivers, and 8,000 teachers
$10.3 billion in annual economic contributions
$2.1 billion in annual federal and payroll taxes
$1.3 billion in annual state and local taxes

MinnesotaMinnesota

120,000 Black immigrant workforce, including 15,000 nursing personnel, 9,000 retail staff, 7,000 delivery drivers, 5,000 taxi drivers, and 5,000 cooks and servers
$5.0 billion in annual economic contributions
$0.8 billion in annual federal and payroll taxes
$0.6 billion in annual state and local taxes

VirginiaVirginia

102,000 Black immigrant workforce, including 8,000 cooks and servers, 7,000 nursing personnel, 6,000 retail staff, 5,000 computer specialists, and 5,000 delivery drivers
$5.8 billion in annual economic contributions
$1.2 billion in annual federal and payroll taxes
$0.8 billion in annual state and local taxes

ConnecticutConnecticut

77,000 Black immigrant workforce, including 17,000 nursing personnel, 7,000 retail staff, 5,000 delivery drivers, 4,000 teachers, and 4,000 healthcare technicians
$3.7 billion in annual economic contributions
$0.7 billion in annual federal and payroll taxes
$0.6 billion in annual state and local taxes

OhioOhio

89,000 Black immigrant workforce, including 9,000 nursing personnel, 7,000 delivery drivers, 3,000 computer specialists, 3,000 factory machine operators, stockers and packers, and 3,000 cooks and servers
$4.3 billion in annual economic contributions
$0.8 billion in annual federal and payroll taxes
$0.6 billion in annual state and local taxes

IndianaIndiana

62,000 Black immigrant workforce, including 8,000 delivery drivers, 6,000 factory machine operators, stockers, and packers, 4,000 nursing personnel, 4,000 custodians, and 3,000 retail staff
$2.7 billion in annual economic contributions
$0.4 billion in annual federal and payroll taxes
$0.4 billion in annual state and local taxes

North CarolinaNorth Carolina

87,000 Black immigrant workforce, including 7,000 nursing personnel, 5,000 delivery drivers, 5,000 factory machine operators, stockers, and packers, 4,000 retail staff, and 3,000 teachers
$4.4 billion in annual economic contributions
$0.8 billion in annual federal and payroll taxes
$0.5 billion in annual state and local taxes

WashingtonWashington

66,000 Black immigrant workforce, including 6,000 nursing personnel, 3,000 retail staff, 3,000 delivery drivers, and 3,000 taxi drivers
$3.7 billion in annual economic contributions
$0.7 billion in annual federal and payroll taxes
$0.5 billion in annual state and local taxes

IllinoisIllinois

63,000 Black immigrant workforce, including 6,000 nursing personnel, 3,000 taxi drivers, 2,000 healthcare technicians, and 2,000 delivery drivers
$3.7 billion in annual economic contributions
$0.7 billion in annual federal and payroll taxes
$0.6 billion in annual state and local taxes

Black immigrants strengthen our communities.

It is critical to ensure they can continue to contribute to our economy and take care of their families.

Data, Methods, Notes

Population and worker estimates are based on augmented 2024 American Community Survey (ACS). Estimates include population adjustments for likely undercounting of immigrants. All estimates were prepared by Dr. Phillip Connor, Research Fellow at Princeton University. See phillip-connor.com for more information on the ACS methodology. Black immigrants include those who self-classify their race as Black and not other races or two or more races.

Economic contribution is the total annual income after the payment of taxes. Federal and payroll taxes are based on tax rates from the Congressional Budget Office. State and local taxes are derived from the Institute on Taxation and Economic Policy's state tax rates and include all forms of state and local taxation. States and metros are top locations of residence for Black immigrants as derived from the ACS analysis.

Occupational categories were collapsed to provide meaningful groups, rounded to thousands. Descriptions of worker services and produced goods are based on researched multipliers and are conservative estimates, refraining from an exact estimate as two or more Black immigrants might be serving the same person or producing the same item.

Tell the world; share this article via...